It can get hot in Adelaide, as all who have endured a summer in the City of Light will know. But hot as it gets, that is not enough for warmists and those who tickle temperature records for a living. Presto! A little computer magic and a lot of “adjustments” transform cooling into the exact opposite
 Blogger Ed Caryl at Germany’s NoTricksZone has discovered that the long-term cooling trend at Adelaide Airport has been “adjusted” into a significant warming. The culprit is NASA’s Goddard Institute for Space Studies (GISS), which has form in producing adjusted data to reinforce the global warming narrative.
Other adjustments by GISS, and our own Bureau of Meteorology, to turn actual cooling into adjusted “warming”, have occurred at (among myriads of examples) Alice Springs, Broken Hill, Willis Island, Bourke and Adelaide. You can see some animations of the adjustments here from blogger Warwick Hughes.
Particularly weird, but purposeful, adjustments by the BOM concern Brisbane Airport, Amberley RAAF, Dubbo, Rutherglen, Rabbit Flat and Carnarvon. “In all those places the adjustments change the trend by more than 2 whole degrees C. It’s a kind of hyper-homogenization,” as Joanne Nova wrote.
Nationally, as much as two-thirds of the current official temperature rise of 0.9degC in the past century is due to BOM “adjustments”. Australia’s manipulators have plenty of company, as UK blogger Paul Homewood has demonstrated by exposing adjustment fiddles for Paraguay.
Concerning Adelaide Airport, blogger Ed Caryl writes:
“While exploring long temperature records in Australia, I discovered a particularly egregious example of temperature changing at Adelaide Airport. GISS now offers easy access to their several sets of data for each station: unadjusted (I assume this is the raw data), adjusted (I assume this is after TOBs, time of observation, and moving adjustments), adjusted after cleaning (whatever that is), and the final step, after adjustments, cleaning, and homogenization.” (TOB stands for “Time of Observation Bias”).
Homogenization is supposed to correct for urban heat island problems, but it is nearly always used to cool the past, rather than cooling the present or heating the past, the opposite of what an urban heat island correction should be.”
Here is the Adelaide Airport record before any adjustments[i]:
 Figure 1: Adelaide Airport unadjusted temperature record. The top trace is the annual average summer (December, January, and February) temperatures, the middle is the annual average meteorological year, and the bottom is the average winter (June, July, and August) temperatures, all with trend lines.
“All the trends here involve cooling since the turn of the twentieth century, for over the last 100 years, particularly in the summer months. The warmest year was 1914. The warmest summer was in 1880!”
Caryl continues, “Now let us look at the ‘adjusted’ data:
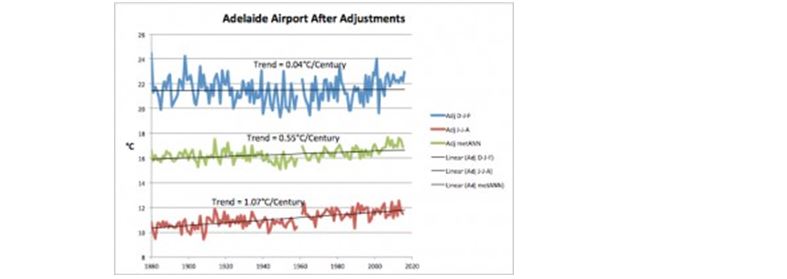 Figure 2: Adelaide Airport after “adjustment”, also with trend lines.
Post-adjustment, we see warming, annually, and in all seasons. The warmest year is now 2007, though the warmest summer (just) is still 1880. But the strange thing about this adjustment is this:
 Figure 3: Adjustment applied to Figure 1 to produce Figure 2.
Caryl writes, “Note that from 1880 to 1947, the adjustment is exactly minus one degree, in all months, all seasons, and all years. It is a blanket, obvious, fudge! Someone got lazy. Instead of attempting to figure out an actual time of observation or move adjustment, they simply slapped on a minus one degree change and, magically, the cooling trend went away. But they were not finished! There is still homogenization to be performed, the finishing touch!
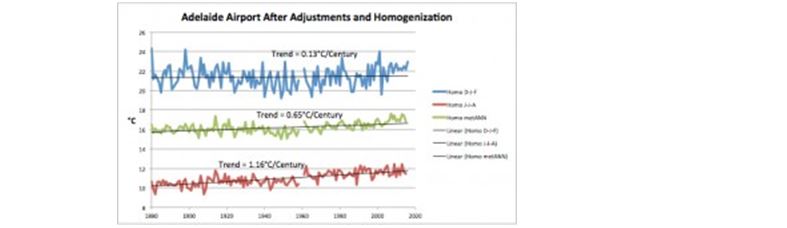 Figure 4: Adelaide Airport after all adjustments and homogenization.
Homogenization now adds another tenth of a degree to the warming temperature trends.
These changes further cool the past and mostly leave the present unchanged. The changes are the same for all months, season, and for twenty-or-more year stretches.
Caryl continues, “I found the Australian Bureau of Meteorology description for their adjustments for Adelaide. They do not resemble the adjustments seen above. They are changes to Tmax [max temp] and Tmin [min temp], and are in both positive and negative directions.
“It should be obvious to all that these [GISS] adjustments to the raw temperature data are an attempt to hide the long-term cooling temperature trend at Adelaide. These changes to the temperature data beg us to examine all station data for similar changes. Is global warming real or just a product of pencil, pen, and computer?”
Meanwhile, there are controversies in the United States, where the National Oceanic & Atmospheric Administration is refusing FOI requests for the rationale for its latest and curious “pause-busting” adjustments and in the United Kingdom, where Climategate emails reveal the incompetent state of the HadCRUT global temperature data. A scholarly investigation by a former Vice-Chancellor of the University of Buckingham is under way.
In New Zealand, the adjusted official record of the National Institute of Water and Atmospheric Research (NIWA) shows warming at a rate equivalent to 1 C°/century since 1900, but the raw data records just 0.3 C° warming per century. NZ sceptics issued a legal challenge to NIWA’s adjusted output but the NZ High Court threw it out, with costs to be paid by the sceptics. The defeat was not on science/data grounds but because the sceptics were deemed to be lacking professional authority and expert qualifications to bring the case! NIWA failed to explain why it had adjusted the raw century-trend of 0.3degC warming to the purported 1.0 degC warming.
Tony Thomas blogs at No B-S Here, I Hope. His book of essays, That’s Debatable – 60 Years in Print, launches at Gambero’s, 166 Lygon St, Carlton, 6.30pm Thursday May 19
[i] One commenter on the Caryl piece injects a lot of local gen:
“Adelaide has had two airports. The first at Parafield north of the City. It was wide open plains, very dry in summer (and hotter than the City). The only business nearby was the abattoirs. It remained in use for light aircraft for many years after most traffic switched to West Beach, with increasing housing and industrial development until it was almost surrounded. The current airport at West Beach started operating in the mid-1950’s (1955 from memory). It is west of the city and not far from the beach on Gulf St. Vincent. Planes normally take off to the SW, over the bordering road (since moved closer to the beach as runway lengthened) then over open sports fields for about a kilometre, then the sea. The Gulf is fairly shallow (max. 20-22 metres) and around 90 kilometres at that point.
Adelaide get a lot of its wind from the SW, S or SE (about 70% or more) which comes from the Southern Ocean, hence cooling. These are very evident at this airport, which is open to them. Also the S & N sides of the airport used to have golf courses, watered by discharge from the nearby sewerage works.
So it isn’t surprising that there should be a cooling from before 1955 to after. Since around 1980 there has been a lot of development on the airport lands (warehousing, shopping centres, hotels, newer terminal with multi-story car parking etc.) so some warming is possible, or the adjustments might have been pulled out of a hat (or thin air).”
